Playing with Legos was a core childhood memory that still elicits a smile whenever I think about it. And now that I’m an adult, playing with one isn’t something I do anymore.
While exploring how to use QGIS during the pandemic, I thought about making a Lego map style. However, since I still need to learn more about the tool, I searched the web and came across this blog post detailing the how-to steps.
However, I never really had the time to do it during the pandemic years, as I was also busy catching up with other new tools at work. And when I tried to make time, I couldn’t figure out how to make it work.
But today, I decided to refresh my basic know-how in navigating the QGIS tool and was glad with the results! I was even more glad I could remember the basic functions that helped me finally understand what this blog post was talking about. I never thought I needed two years for me to grasp it fully! Perhaps because in those years, I also got to know QGIS better.
Here’s what I came up with for the Philippine map, Lego map style:
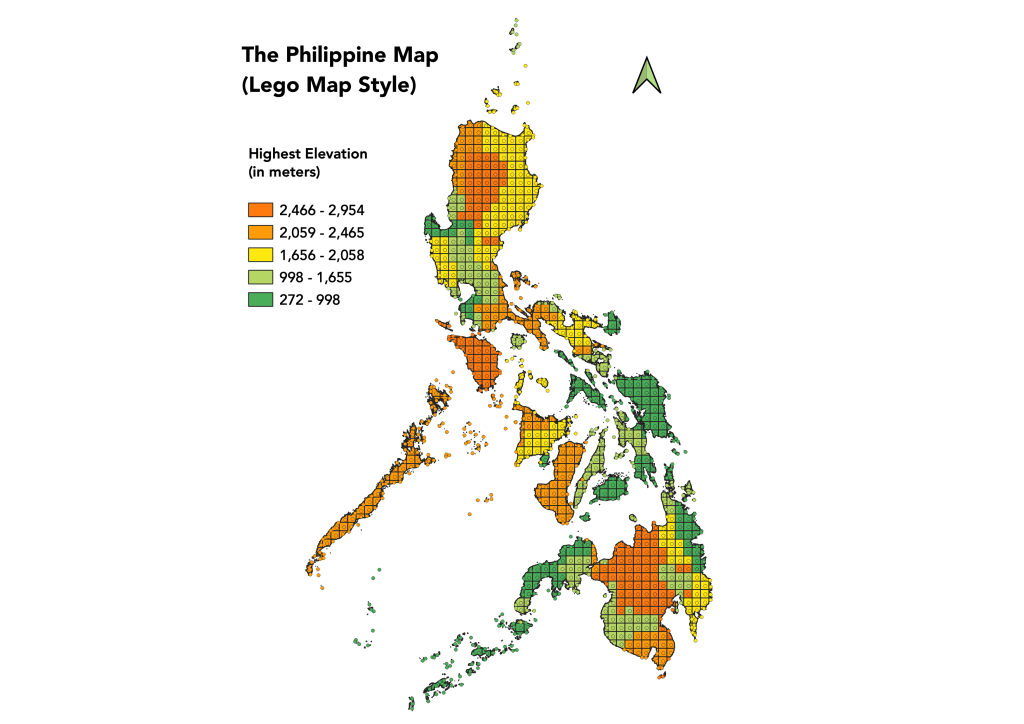
Since the Philippines is archipelagic, the centroids for the grid in the small islands looked like data points sparingly spread on the map. But the Lego map style was pretty decent for the rest of the map.
For the highest elevation data, I sourced them out through Wikipedia per province. The Philippines has a total of 81 provinces.
